“Your charts don’t need to be perfect, just thoughtful. You don’t even have to be able to draw. Just put the child before the chart.”
— Marjorie Martinelli and Kristi Mraz
Charts. They are EVERYWHERE! Love ‘em or hate ‘em, charts are an expected norm in most classrooms today. But… what does a great chart look like? What kinds of charts should you use? How many is too many? Where do you display them? How long do you keep them? How do you know if they are working? So many questions.
Well then. Where do you start?
With your students, of course! It is important to use what you know about your students to make powerful, accessible charts that are differentiated based on individual and group needs. With that said, the best place to start is with what your students need, combined with the curriculum, to develop big ideas and explicit teaching points. And no matter what, children need to be active participants in the making of a chart. Enter the Chartchums.
Charts are something most teachers make. Most teachers have made hundreds of charts. Yet the Chartchums (aka Marjorie Martinelli and Kristi Mraz) found that when they did a reading or writing workshop, THEIR CHARTS were the real stars. Over and over they heard teachers say, “You should write a book on charts,” while they snapped photos of the sample charts.
So they did.
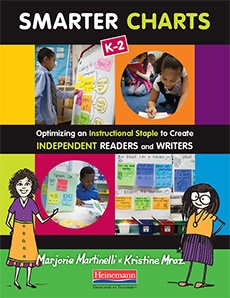
Their first book, Smarter Charts, provides the basics of effective charting, including the language of charts (both words and visuals), when to make them, where to put them, how to get kids to use them, and ways to assess their effectiveness. Using tips, checklists, and best practices, Marjorie and Kristi share how to bring charts to life using music, chants, rhymes, and more to truly make charts memorable and fun for all of your students.
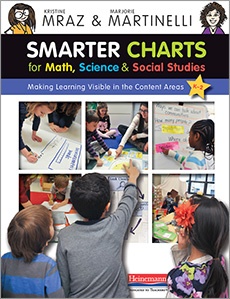
They talked to more teachers. What does effective charting look like in math? Social studies? Science? Can you apply what you know about literacy charts to all subject areas? They wrote their second book, Smarter Charts for Math, Science & Social Studies. Continuing the dialogue on chart making that they started in Smarter Charts, Kristi and Marjorie show teachers how to turn complex ideas into kid-friendly visuals, help children internalize content processes, and even increase instructional time. You don’t have to be a subject-matter expert to make learning visible for the students in front of you.
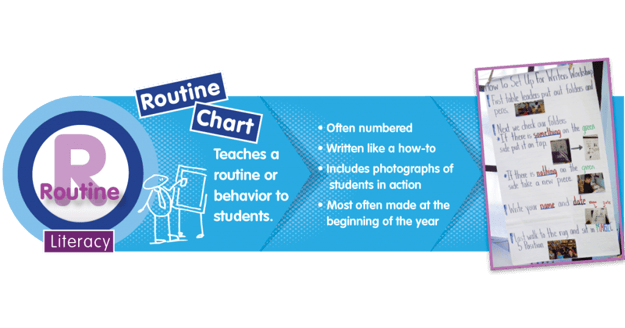
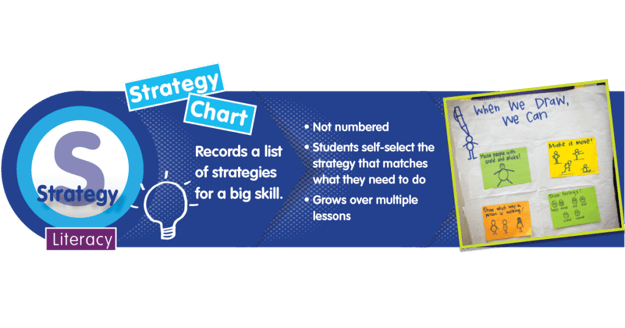
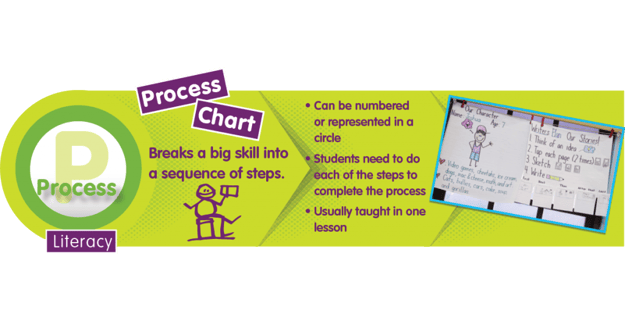
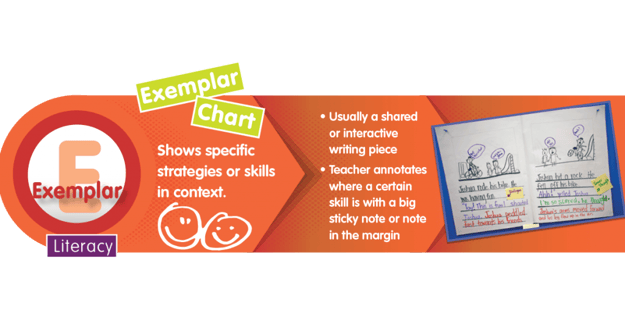
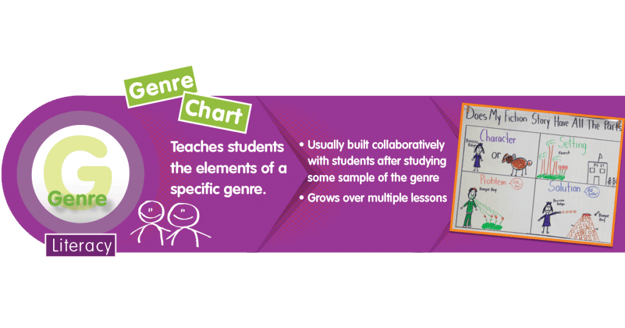
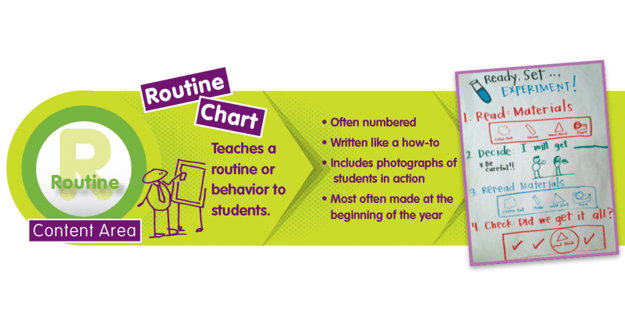
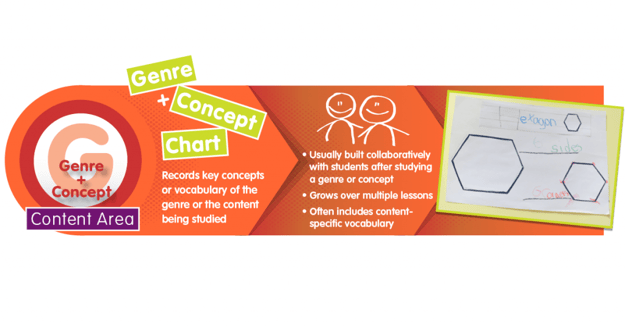
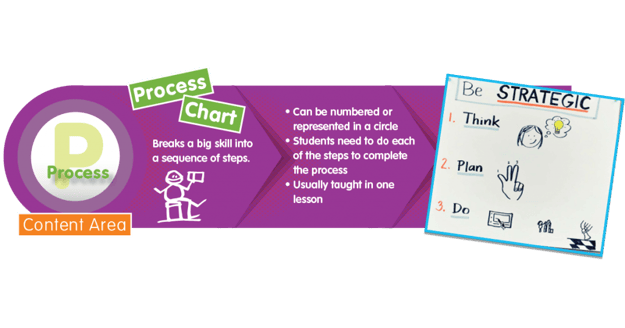
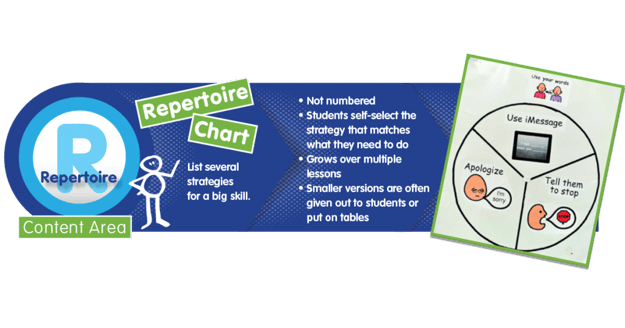
Marjorie and Kristi have developed names and descriptions for different kinds of charts to make it easier to talk about the various pathways of learning and thinking they present to students. In both Smarter Charts books, they describe how each type of chart is made and used, complete with examples, visuals, and reproducibles. Different types of charts serve different purposes in classrooms. You don’t need to have one of each type in your classroom. You might find that you make one type of chart much more frequently than another… and some you don’t make at all.
A chart is never just a chart. Charts are like billboards for your teaching. No matter what the area of the curriculum, clear visuals, simple language, and constant reflection on charts are the key to helping children be more independent, efficient, and flexible in their learning. Packed with full-color sample charts from real classrooms, the Smarter Charts books will help you with tips on design and language, instructional use, and self-assessment. Even better, you will discover strategies that deepen engagement, strengthen retention, and heighten independence—all by involving students in chart making.
A chart is never just a chart.
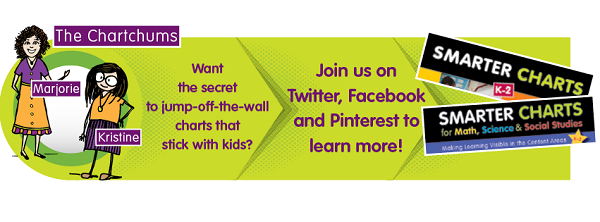
What’s stopping you from creating jump-off-the-wall charts that stick with kids? You can’t draw? You don’t have to be an artist to make great charts. Really. But it never hurts to see if you can improve on some of the basics, like people and icons. Remember, you don’t need to be perfect, just thoughtful. What matters most is that children are engaged in the process of making the chart.
Not sure what to put on your charts or how to get your students to use charts more independently? Want to learn more? Need some inspiration? Make sure to join us on Twitter, Facebook, and Pinterest as we break down the different types of charts with handy and helpful visuals from Marjorie (@Marjorie_Writes) and Kristi (@MrazKristine) that will help you turn your classroom charts into teaching powerhouses. You can also visit this post to see a visual recap of the different types of charts.
A Field Guide to Content Charts.
A Field Guide to Literacy Charts.